
Analytics are useful tools that provide statistics and performance metrics over set time periods and allow you to compare them. By monitoring these analytics, you can see performance trends over time. When comparing these performance trends against performance initiatives, you can determine which approaches have effective positive or negative results. You can also plan to adjust your overall approach to align with the results indicated by the metrics.
Slack offers a set of analytics specifically covering the performance metrics of the members of your workspace. All tiers of Slack workspaces have access to some basic analytics; however, a number of data points are not available for free tier accounts. Free tier Slack workspaces can only see the list of users in the workspace, their userID’s, their usernames, their email addresses, and when the account was created.
Paid accounts can also see if the user is included in the workspace bill, the number of messages each user has posted, the number of messages each user has posted in channels, and the number of reactions the user has left on messages. The list continues with the number of days since the user was last active on any platform, a breakdown of the number of days since the user was last active on iOS, Android, and desktop platforms. The number of days the user has been active on any platform. Then there’s a breakdown of the number of days the user was active on iOS, Android, and desktop platforms.
How to See Member Analytics for Slack Members
To be able to view these analytics for your workspace you need to go to the analytics dashboard. Click on the workspace name in the top-right corner, then in the dropdown menu, select “Tools.” Then choose “Analytics” to open the analytics in a new tab.

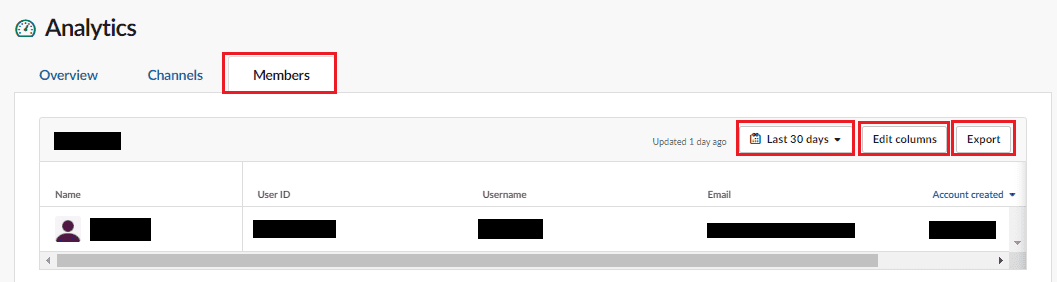
Once on the analytics page, switch to the “Members” tab to see the member analytics. It’s possible to configure the columns of data that are visible by ticking and unticking the relevant checkboxes after clicking “Edit columns” to the top-right of the table. You can configure the time period the dataset covers by clicking the “Last 30 days” dropdown box. Then select an alternative time period. You can also export the dataset as a CSV file for your own records by clicking the “Export” button.
The member analytics section can provide useful insights into how people are using your workspace. By following the steps in this guide, you can view the member analytics for your workspace and configure the data shown.