

If you want to view the source code of a web page in Apple Safari for macOS Sierra, you’ll have to enable the Safari Web Inspector tool using the following methods.
Web browser developers like Apple, Google, etc., provide an out-of-the-box tool to view the underlying codes. The developers mostly use this to debug and visualize changes made on a live website without disturbing the actual code in the server. However, this tool has now become popular among content creators and tech-savvy internet users who want to edit a live website for personal or professional purposes. If you’re one of those, read the article until the end to know everything about Safari Web Inspector and how to inspect element.
Contents
What Is Safari Web Inspector?

Web Inspector is a part of the bundle of development tools that Apple offers to website and app developers around the world. The tool is available for both macOS and iOS devices. Developers can effortlessly modify, optimize, and debug websites to get peak performance for their online properties.
The Web Inspector tool on Safari brings most website resources under one unified interface. The tool also separates the resources and their parameters in dedicated tabs so that you don’t get overwhelmed with so many codes and options. Web Inspector also gives you a Timeline view of the website memory so you can debug the memory easily. Moreover, being a developer, you can tweak and optimize more than 150 popular CSS properties that you need in developing a functional website.
On the Web Inspector tool, you get the following tabs for website resources:
- Elements
- Console
- Sources
- Network
- Timelines
- Storage
- Graphics
- Layers
- Audit
How to Activate the Safari Web Inspector in Safari 10 and Above
By default, Apple Mac disables the Web Inspector in Safari. This is to prevent unnecessary clutter on the web browser user interface (UI). However, if you’re a developer, content creator, and expert Mac user, you may want to activate the feature by following these steps:
- Open the Safari app on your MacBook or iMac.
- Make sure you clicked the browser to get the Safari icon on the Mac toolbar.

- Click Safari on the top-left corner and select Preferences.
- Alternatively, you can use the hotkey Command + , to show the Preferences menu.
- While inside the Preferences menu, you must be on the General tab.
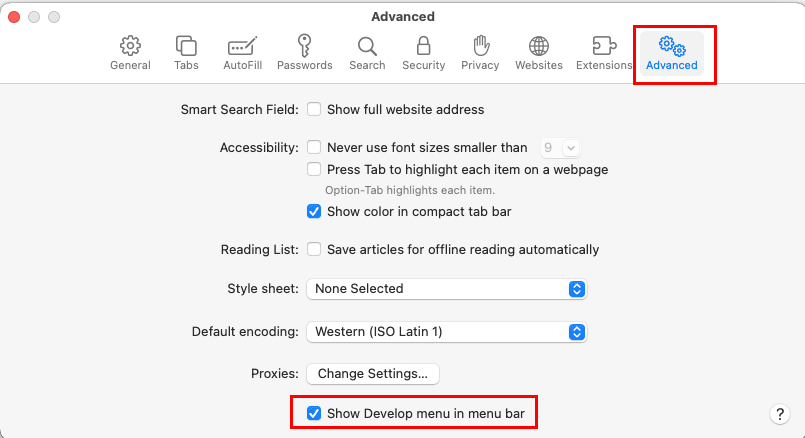
- Navigate to the Advanced tab.
- Just below the Proxies option, you should see the checkbox for the Show Develop menu in menu bar. Check the box.

- Now, the Safari Develop menu will show up on the Mac toolbar.
This is how you can activate the Web Inspector feature on your Mac browser Safari. The steps are similar for the most recent macOS edition Ventura, and earlier ones like Monterey, Big Sur, Catalina, etc., until Jaguar.
Also read: Html 4.01
So far, you learned how to get the Web Inspector feature on the Mac Safari app. Learn below how to use it on Safari for live websites:
How to Use the Safari Web Inspector on macOS
Find below the steps to call the Web Inspector tool for web development, content creation, or any other purposes. In this article, I’m showing the steps using the macOS Monterey operating system. However, the steps are pretty similar from macOS Jaguar to Venture.
- Open Safari and visit any website that you want to inspect.
- There are two ways to inspect the underlying HTML/CSS codes of a website or make changes using the Apple developer tool Web Inspector. These are:
- Develop > Show Web Inspector.
- Right-click > Inspect Element.
- To use the first one, head over to the Mac toolbar for the Safari browser and click the Develop menu.
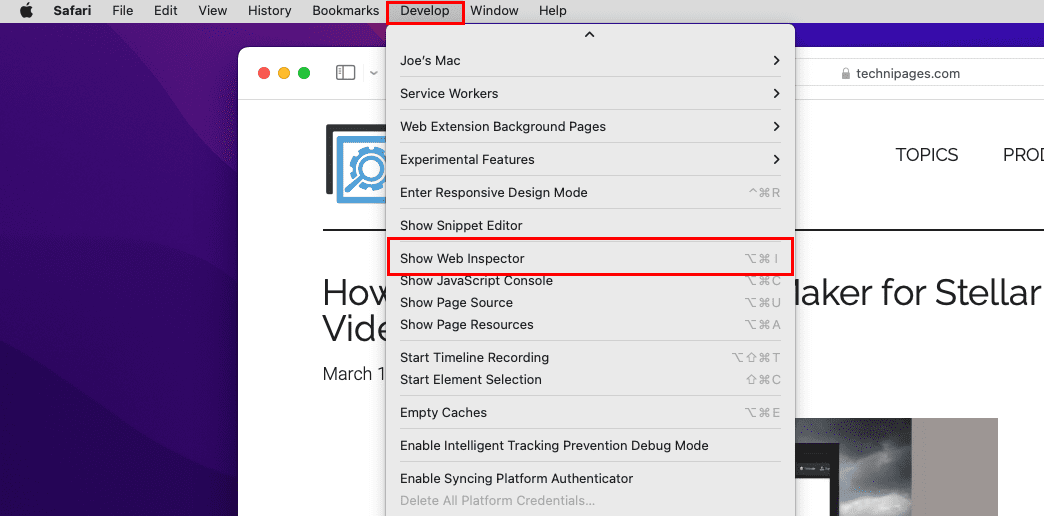
- In the context menu that pops up, click Show Web Inspector. The hotkey for this action is Option + Command + I.

- This will open the Web Inspector tool in the lower half of the web browser. The codes you see are for the entire URL or web page you accessed.
- If you want to visualize the underlying code for a specific element on the web page without opening the code for the entire web page, select the element you want to inspect.

- Right-click and select Inspect Element on the context menu that opens.
- The Web Inspector of Safari will open.

- But this time, Safari will take you directly to the underlying HTML or CSS code of the element you’re auditing.
- In this tool, you get the HTML and CSS codes of the web page element you’re inspecting.
Also read: Technipages Explains CSS
How to Open the Safari Web Inspector in Older Versions of macOS
Suppose, you’re on a Mac older than Jaguar and need to use the Web Inspector tool. If you don’t find the above steps in that Mac, you can execute a simple code to activate Web Inspector. Here’s how it’s done:
- Open Applications and go to the Utilities folder.
- Inside Utility, you should find Terminal. It’s the command prompt of macOS computers.
- Now, launch the Terminal command line interface and type in the following simple command:
defaults write com.apple.Safari WebKitDeveloperExtras -bool true

- Hit Return to execute the command.
- Now you can open a web page in Safari and right-click or hold down your mouse button anywhere on the page until the context menu appears.
- There, click the Inspect Element option to view the underlying CSS and HTML codes of the website.
Safari Web Inspector: The Final Words
So these are the methods to enable Web Inspector in Safari effortlessly. You can follow the steps on your own and get started with developing or content creation in a few minutes. You learned the methods to activate Inspector Element on Safari for both new and legacy macOS editions. If I missed any method to get and use Web Inspector, don’t hesitate to let me know by leaving a comment below.
Next up, the best coding apps for iPad.


No.
I have all this but in the develop menu web inspector is dimmed and not active.
I need to active this menu which exits but dead on my safari on HS last version.
Need help
TIA