
If you’ve just finished building your new computer, or are overclocking it to get that little bit of extra performance, you will likely want to actually see a performance metric to see how good it is. While you could boot up some of your favourite games and keep an eye on the FPS counter, it can be hard to directly compare results.
This is where PC benchmarks come in, they have pre-defined tests and can monitor your computer’s performance in them. All of them give you an easily measurable and comparable result at the end. Some benchmarks only test a certain aspect of your system performance while others include a full testing suite and analyse the performance of many of your computer’s components. Below is our list of top five free PC benchmarking tools.
3D Mark

For gamers, the most important metric is graphics performance. This isn’t necessarily as straight forward as which graphics card you have though, as other components can end up causing bottlenecks. 3D Mark is a suite of graphics testing tools for a range of different levels of computer. Some tests are aimed at high-end computers and others are aimed at testing integrated graphics performance.
The free option includes four tests, One for integrated graphics, one for mid-range gaming computers and laptops, and two for high-end gaming PCs. These tests provide a realistic comparison of in-game performances.
A paid version is also available which includes a number of other tests including cutting-edge new features such as raytracing. 3D Mark is distributed through Steam here.
Unigine Benchmark

Unigine offers five graphics benchmarks running from 2007 to 2017. While Sanctuary and Tropics are both listed as “Legacy” and do show their age, Heaven, Valley and Superposition all look great and offer a benchmark in a real game engine. You can toggle certain in-benchmark settings during the run to see what effects they have on appearance and performance.
Cinebench

Cinebench, specifically Cinebench R20, is a specifically CPU orientated benchmark, where your CPU renders a pre-defined scene. There are two parts of the test, single-threaded and multi-threaded performance. When both parts have been completed you can also see the “MP Ratio” of your processor which is a measure of how much faster multi-threaded performance is over the single-threaded performance. This test is particularly effective for testing a CPU overclock as it is purely a CPU test.
CrystalDiskMark

CrystalDiskMark isn’t a benchmark for your CPU or GPU but instead is a benchmark for your hard drives. You can use it to test the read and write speeds of your hard drives in both sequential and random4k tests. You can also configure the size of the file used for the test, which will affect how long it takes. Faster results here, affect how quickly your computer can read and write data which can be important in loading and boot up times.
Note: As this test specifically writes data to your hard drive, long-term use will reduce the lifespan of SSDs. Short term usage is fine, especially if you don’t use the largest of the test data sets.
UserBenchmark
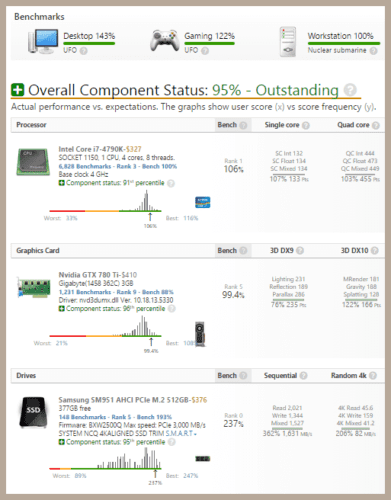
UserBenchmark is a broad set of benchmarks designed to test the performance of the four main components of your computer. It measures your CPU, GPU, hard drive, and RAM performance. Once your test is complete, you can see the raw statistics as well as comparisons for how your components did against other users. At the bottom of the results page, you also get a graph showing system memory latency, this covers memory in the CPU cache as well as your RAM.
UserBenchmark is a great tool to see how your systems stacks up against similar systems. It can also highlight issues that you may not have noticed before without there having been a leader board of the same hardware being tested by other users.