
Learn how to turn Native Code Debugging on or off in Microsoft Visual Studio using these steps.
C# and VB.net Projects
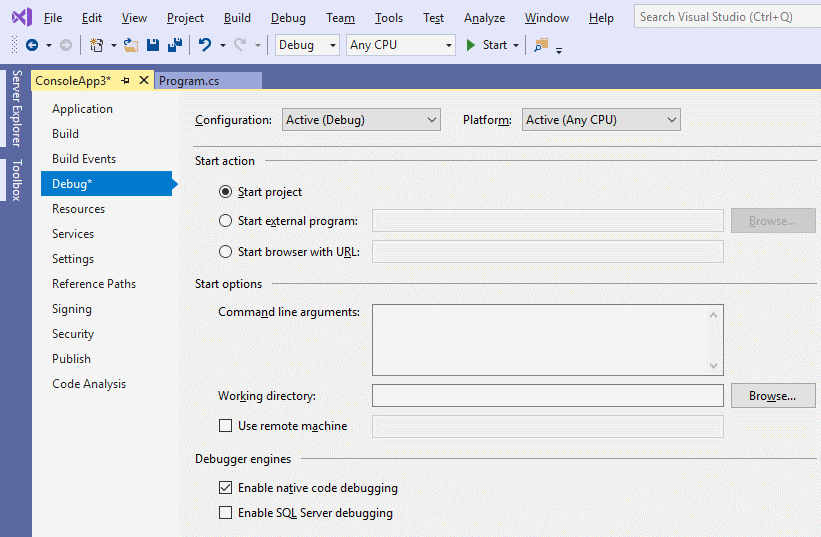
- With your project open, select the “Project” tab, then choose “appname Properties…“.
- Select “Debug” on the left pane.
- Check the “Enable native code debugging” box to enable it. Uncheck it to disable it.
C++ Projects
With your project open, select
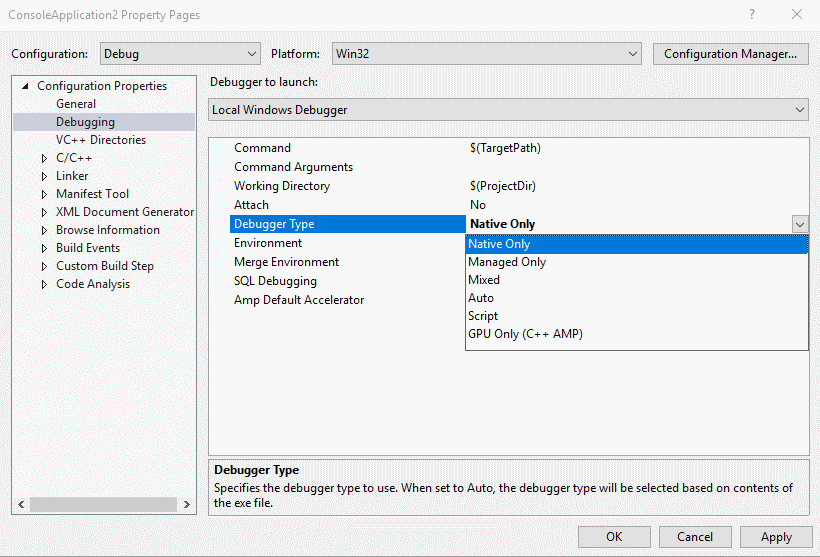
- With your project open, select the “Project” tab, then choose “appname Properties…“.
- Select “Debugging” on the left pane.
- Set the “Debugger Type” setting as desired to one of the following:
- Native Only
- Managed Only
- Mixed
- Auto
- Script
- GPU Only


Hi,
During code loading (with above configuration) I can see in the output pane the following comment multiple times:
“Exception thrown at 0x00007FFC18BA4F69 in TrackSim.exe: Microsoft C++ exception: EEFileLoadException at memory location 0x000000FE343FB100.
Exception thrown at 0x00007FFC18BA4F69 in TrackSim.exe: Microsoft C++ exception: [rethrow] at memory location 0x0000000000000000.”
Is there something else that needs to be configured so these messages are eliminated?
PS. the debug process works as expected
Thanks
Thanks for the Help. I am able debug into Cpp from C#.
Thanks!