
If you’re a Linux user, you may find that CPU (or central processing unit) consumption is getting unusually high. Why is your main processing system working so hard?
There are two primary ways to get down to the bottom of this issue. The first is by using “ps command,” and the second is “top command.” We will be focusing on the most popular option: top command.
Regardless of which one you go for, however, both of these methods will produce effective results. You are, therefore, at liberty to choose either of them.
Contents
Why Monitor CPU Usage?
It is essential to monitor the Linux CPU usage for efficiency and convenience regularly. Whenever a given process engages your Linux CPU system, it generally becomes unavailable to process other requests. Thus, the pending requests have to remain in the queue and wait for the CPU to be free. This can slow down your computer and become a hindrance that simply lurks in your system.
We don’t like hindrances, and we’re sure you don’t like them either.
It is incredibly important to get to know the overall consumption processes and utilization mechanisms for a Linux CPU. Yes, this is among the most important tasks that a Linux user can ever manage.
If you use the right command method, you can identify and determine what is making your CPU work so hard. In turn, this will help you troubleshoot all performance issues on a Linux system relating to the CPU.
How to Use the Top Command to Determine High Consumption in Linux CPU
As noted, top command is one of the better-known methods that most people use to track the Linux CPU performance system. I mean, it has been around since 1984. Seems pretty reliable to us!
With top command, users can access real-time, dynamic data on Linux system running processes.
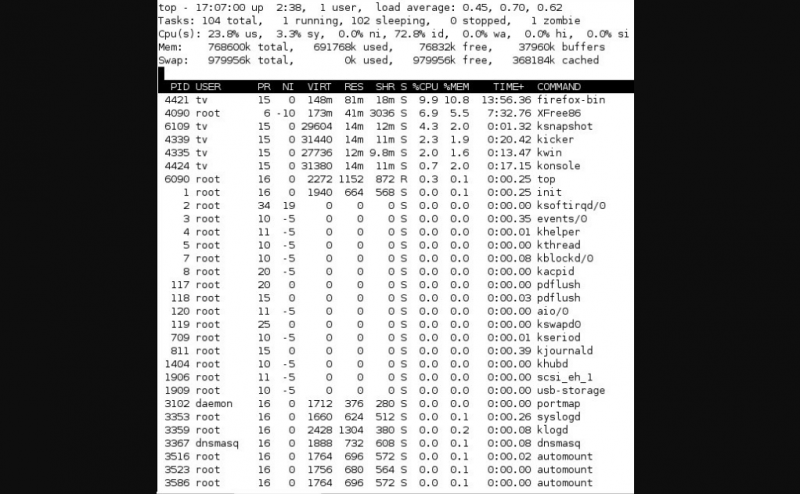
Top command conveniently displays crucial information about the system summary or catalog of processes that are administered by the kernel. This includes memory usage, system load, system uptime, swap memory, overall running processes, buffer size, process PID, and Cache size.
Furthermore, you may find that top command neatly sorts the CPU usage with the top output by default. It also automatically updates after 5 seconds. Run this command while in batch mode for the best results.
Learn the Symbols that Guide a Typical Top Command Model
It is beneficial to learn the basic symbols that guide the typical top command model. This will help you to carry out a successful troubleshooting process. Though it takes time to do this, the benefits will be long-lasting and most satisfying.
Here are some of the most common symbols that govern a typical top command process.
- “Top:” This is the symbol for the typical “top command.”
- Batch mode is represented by the symbol “-d.”
- “Head -50” is an important symbol for displaying the “first 50 output lines.”
- The unique process ID is represented by “PID.”
- “USER” represents the process owner.
- “PR” represents the process priority.
- “NI” represents the processes’ NICE value.
- “VIRT” represents the volume of “virtual memory” consumed by the process.
- “RES” represents the total “physical memory” consumed by the process.
- “SHR” represents the memory shared by the process.
- “S” indicates the process status (the sleep process), “Z”-Zombie, “R”-running.
- “%CPU” Represents the CPU percentage consumed by the process.
- “%MEM” Represents the RAM percentage used up by the process.
- “TIME+” indicates the time that the process runs.
- “COMMAND” represents the process name.
The symbol “ps” represents the “process status.” You can use it to display information on the system’s running and active processes. It also gives a preview on the existing processes as well as other detailed information. This includes user id, CPU usage, username, memory usage, command name, and the start name for this process.
Troubleshooting: Collect Comprehensive Data on High CPU Consumption
You need to collect several types of data while troubleshooting high CPU utilization for a Linux system. These are also referred to as Out of Memory errors. Thus, make sure to collect this data and submit it to the manufacturer as soon as an issue arises. Once you do this, it will help fast-track the process for resolving the matter.
Also, do not forget to include the following essential information:
- Configuration directory
- Debug logs
- Current options and JVM stack traces
- GC logs and Garbage Collector
- Thread information/ Process
Make sure to include additional information on other symptoms that the system experiences. Gather all data at the pinpointed area where the issue first arose. This guarantees that the data and the timestamps related to the issue always correspond.
Conclusion
Learn the basic commands and essential troubleshooting symbols that enable you to determine high consumption levels for your Linux device successfully. Fortunately, Linux provides many practical utilities that can help you determine the causes of high CPU utilization with sharp accuracy. Master these processes and you’ll be one step ahead of everyone else.