

When Windows 10 freezes or crashes, you may sometimes find a debug.txt file on your desktop. You can open the file using a simple text editor.
The debug file usually contains information about the errors that you encountered. Sometimes, you may also find details about the pieces of hardware affected or the software that triggered the problem.
The most common causes for program or system crashes include corrupted files, corrupted Registry keys, and program incompatibility issues.
Browsers Are Dropping Debug Files on Your Desktop
The debug file may pop up on the desktop after an app or program crashes. It’s not exclusive to Windows 10 system crashes.
As a matter of fact, Chromium-based browsers sometimes drop debug files on users’ desktops. The respective files are usually named debug.log.
The most annoying part is that you cannot permanently delete that file. Even if you remove it, it will re-appear after you restart your machine. It seems this is only a glitch that occasionally re-activates itself.
Can I delete the debug file from my desktop?
Windows 10 users can safely delete the debug files from the desktop. The debug files are harmless and nothing bad will happen to your system if you remove them.
Contents
What to do if There’s a Debug File on Desktop
There are a few quick actions that you can take if you notice there’s a debug file on your desktop. One is to run the SFC tool. The second one is to run the DISM tool. Both tools can help you to get rid of corrupted system files.
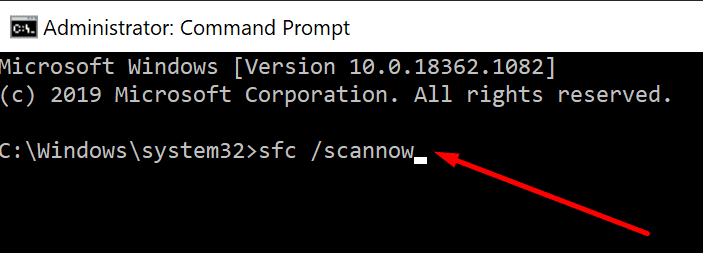
Run SFC
- Go to Windows search and type cmd.
- Then right-click on Command Prompt and run it with admin rights.
- Enter the sfc /scannow command and press Enter.

- Wait until the tool has scanned your system.
- Restart your computer and check if the crashes persist.
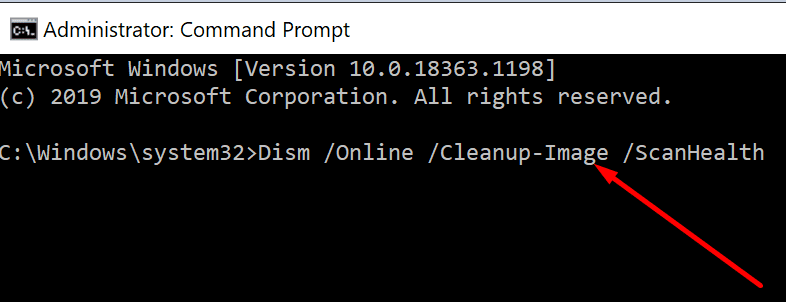
Run DISM
If the problem persists, use DISM. This is a complementary tool to SFC that performs an in-depth scan of your Windows OS.
- Launch Command Prompt as admin.
- Then enter the following commands and press Enter after each one:
- DISM.exe /Online /Cleanup-image /Scanhealth

- DISM.exe /Online /Cleanup-image /Restorehealth
- DISM.exe /Online /Cleanup-image /Scanhealth
- Restart your computer.
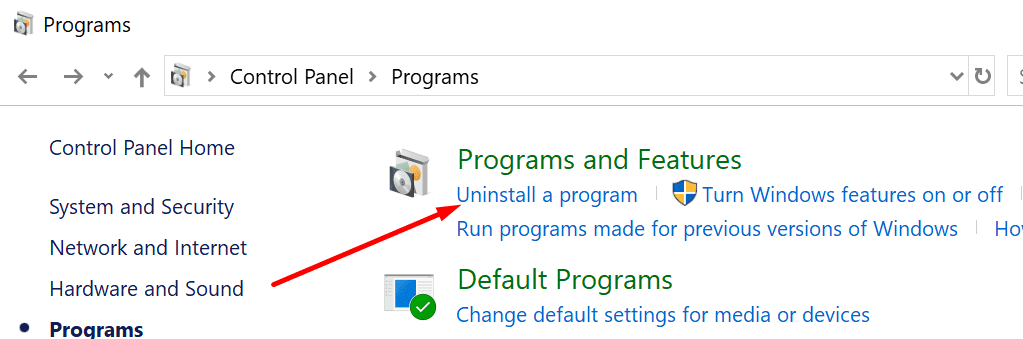
Uninstall Recently Installed Programs
If the debug file appeared after you installed a new tool on your machine, try uninstalling it. Maybe the program that you recently installed is incompatible with certain system settings or other programs running on your machine.
- Launch Control Panel.
- Go to Programs.
- Then select Programs and Apps.
- Click on Uninstall a program.

- Select the program you recently added and remove it.
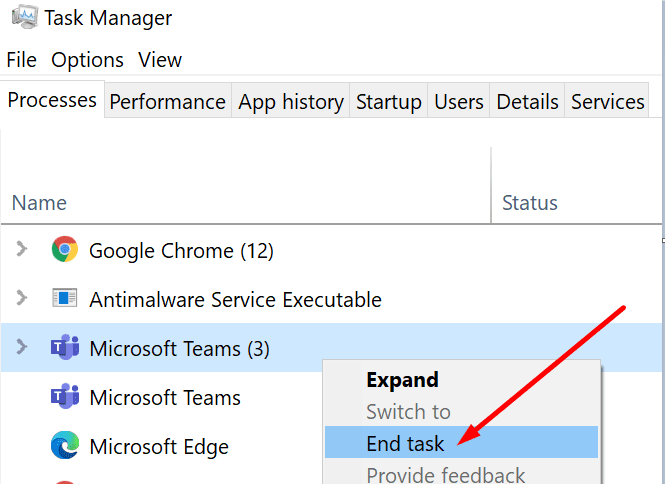
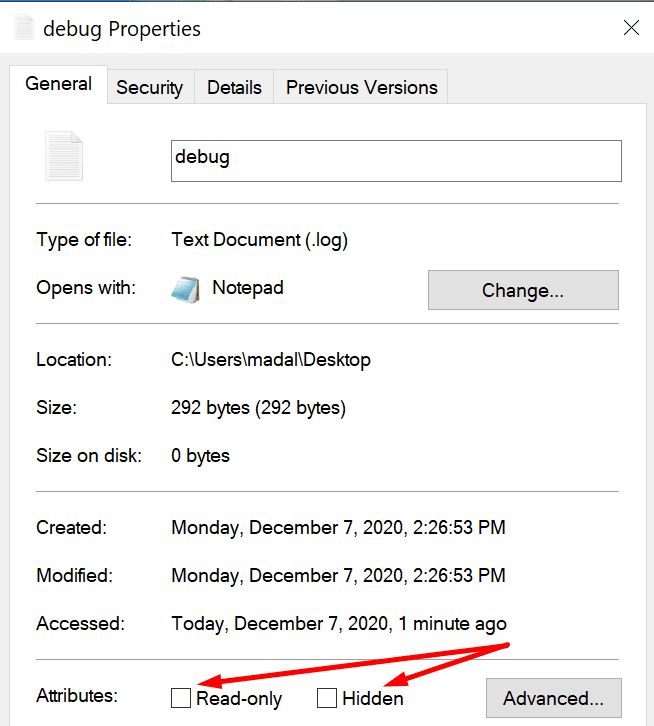
Make the Debug File Read-Only
If the debug file keeps popping back on your desktop, you can hide it and make it read-only. In this manner, it will no longer be visible on your screen. At the same time, the OS or the program that initially created it won’t be able to update it or generate it again.
- Close all the background programs using the Task Manager.
- Right-click on the program and select End Task.

- Right-click on the program and select End Task.
- Right-click on the debug file.
- Then select Properties.
- Next, locate the Read-Only and Hidden options.

- Check these options and save the changes.
- Restart your computer.
How to Prevent Browsers from Creating Debug Files on Desktop
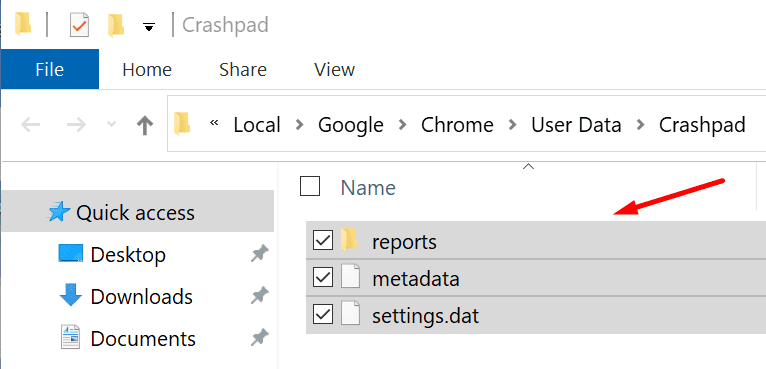
Delete the Crashpad Folder
If you want to stop your browser from creating debug files on your desktop, follow the steps below.
- Press the Windows and R keys to open a Run window.
- Then, enter one of the following paths:
- %localappdata%\Google\Chrome\User Data\Crashpad (for Chrome users.
- %localappdata%\Microsoft\Edge\User Data\Crashpad (for Microsoft Edge users).
- Next, delete absolutely all the files and folders from the Crashpad folder.

- Restart your machine to prevent the browser from placing a new debug.log file on your desktop.
Update Your Browser
If this problem was trigger by some glitch in the code, try updating your browser. Both Google and Microsoft are usually quick to solve browser issues. Hopefully, the problem is already patched in the latest browser version.


I keep getting error if we try to launch protools.
It says the procedure entry point SetThreadDescription could not be located in the dynamic link library. C:\Program Files\Avid\ProTools\DigiPlatformSupport.dll