If you have overclocked your computer to improve performance, one of the most important pieces of information you might want Windows to display is the CPU temperature. Even if you haven’t overclocked your computer, the thermals can still be a useful piece of information to know.
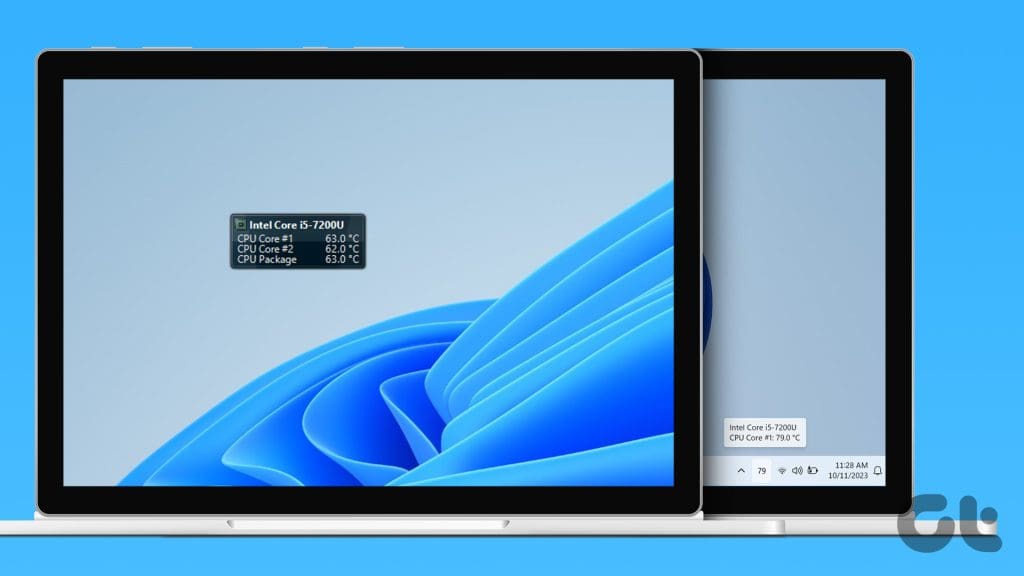
Luckily, it is possible to make Windows show the temperature of your CPU on the desktop or taskbar using a third-party tool. You can also check the CPU temperature natively. Here we show you how.
Show CPU Temperature on Screen on Windows PC
Open Hardware Monitor is a free open-source software that makes it easy to monitor a number of hardware statistics for your computer. Here’s how to use it to get a CPU temperature monitor widget on your Windows desktop.
Step 1: Use the following link to download and install the Open Hardware Monitor on your PC.
Step 2: Launch the Open Hardware Monitor app and locate the Temperatures section under your CPU. Right-click on the entry that you want to see on your desktop and select the Show in Gadget option.
You can repeat this step for more entries if you want.
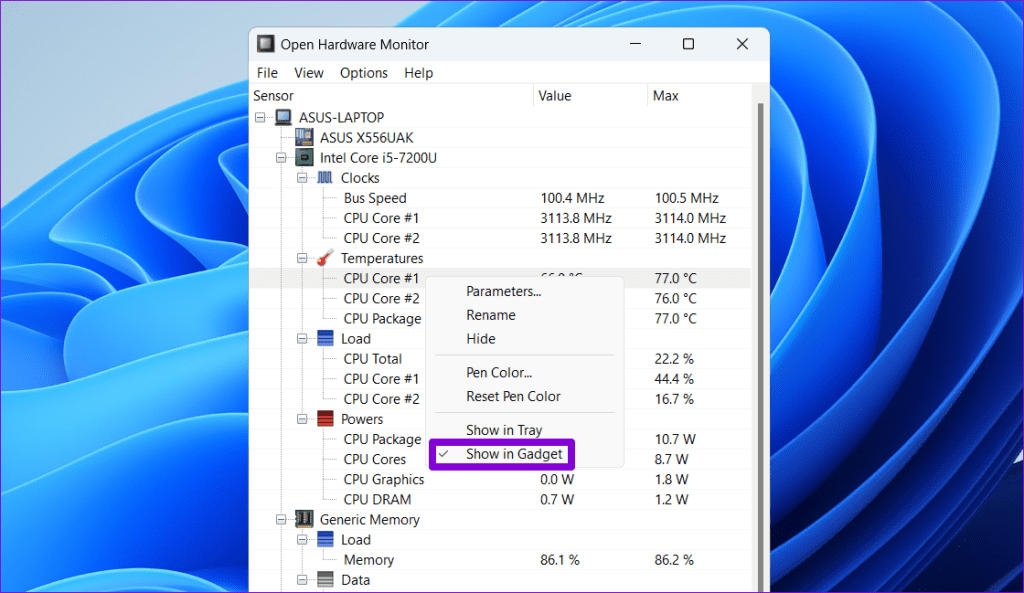
Note: You may see multiple temperature readings for your CPU as each CPU core has its temperature sensor and an independently positioned package sensor. Your motherboard may also have a number of CPU temperature sensors.
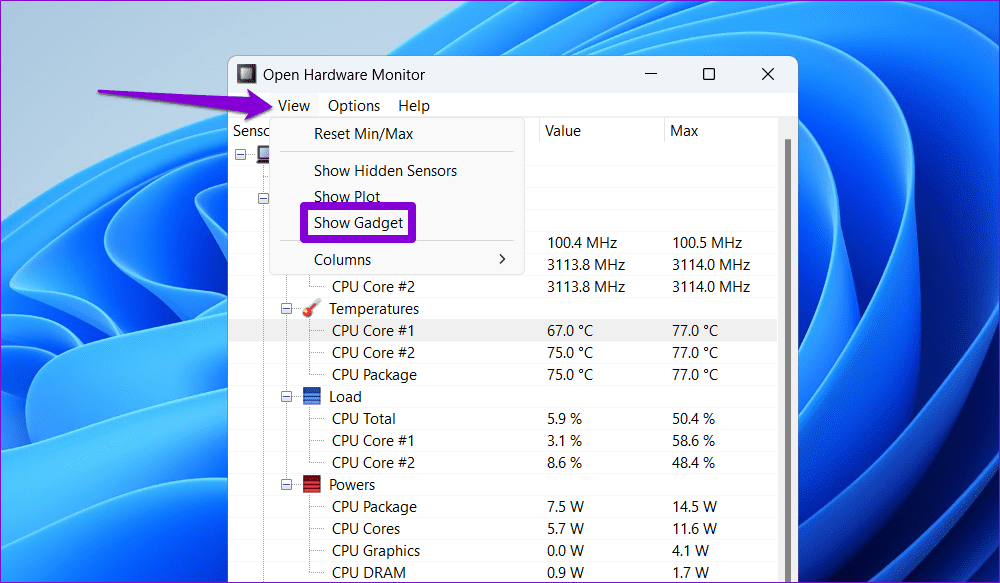
Step 3: Click the View menu at the top and select Show Gadget from the resulting menu.
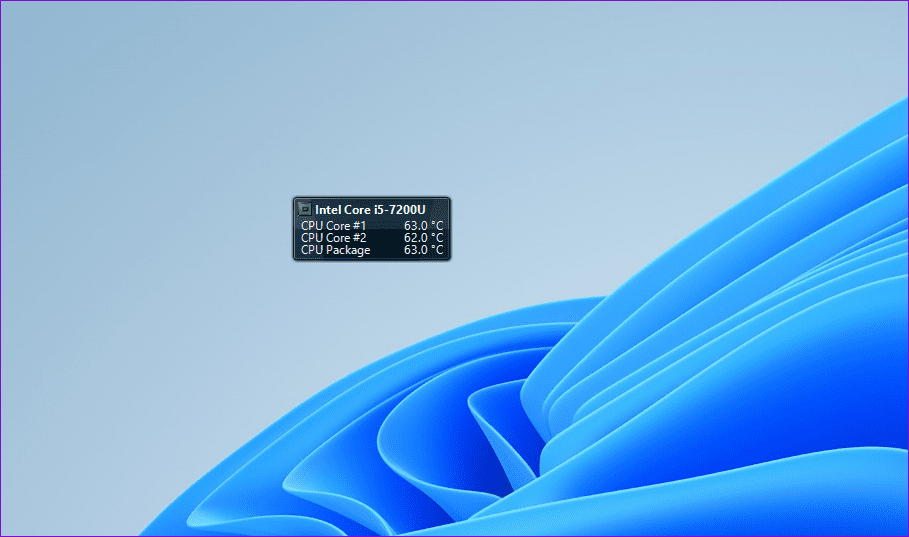
Once you complete the above steps, you should see a small widget on your desktop that will display your PC’s CPU temperature. You can click and drag the widget to move it to your preferred location.
Display CPU Temperature Monitor Widget in Taskbar
While a desktop widget that shows CPU temperature is handy, Open Hardware Monitor can also show this information on the Windows taskbar. This can be helpful because the taskbar is always visible.
To display CPU temperature on the Windows taskbar:
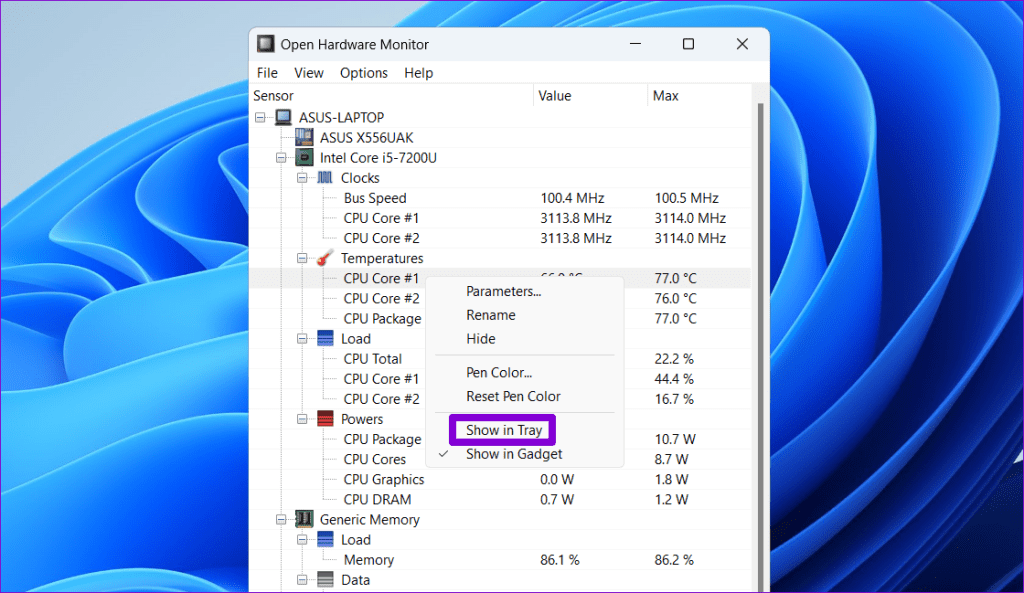
Step 1: Launch the Open Hardware Monitor app and locate the Temperatures section under your CPU.
Step 2: Right-click the entry you want to see on the taskbar and select Show in Tray.
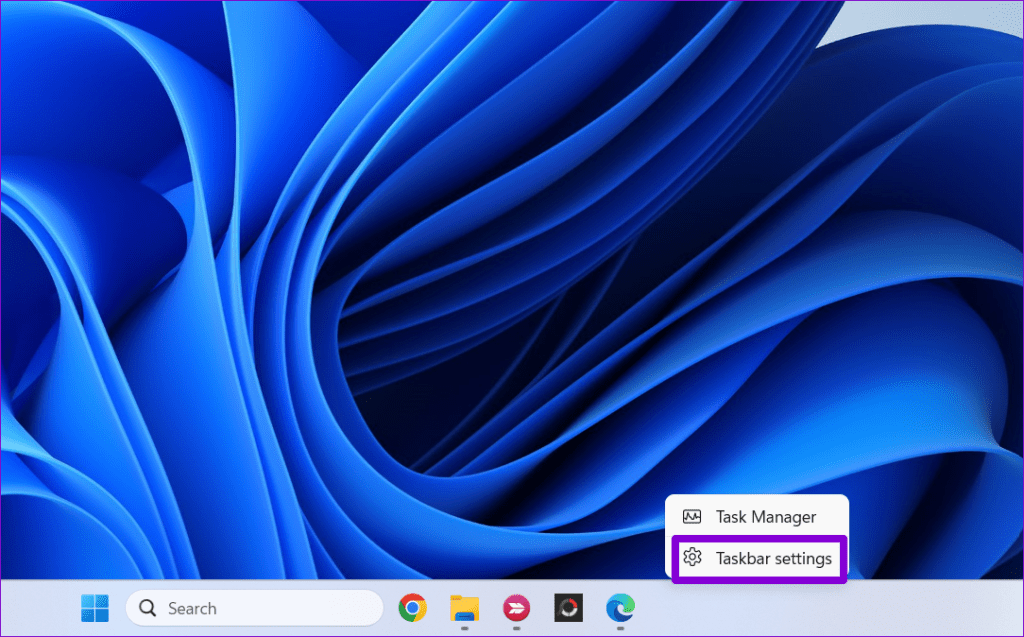
Step 3: Right-click on your taskbar and select Taskbar settings.
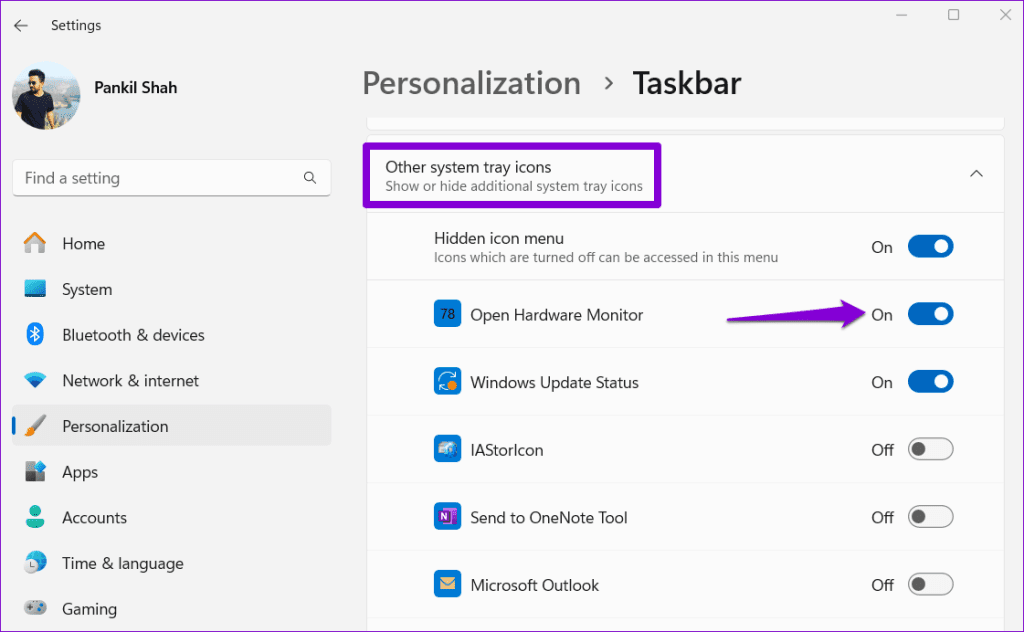
Step 4: Expand ‘Other system tray icons’ and enable the toggle for Open Hardware Monitor.
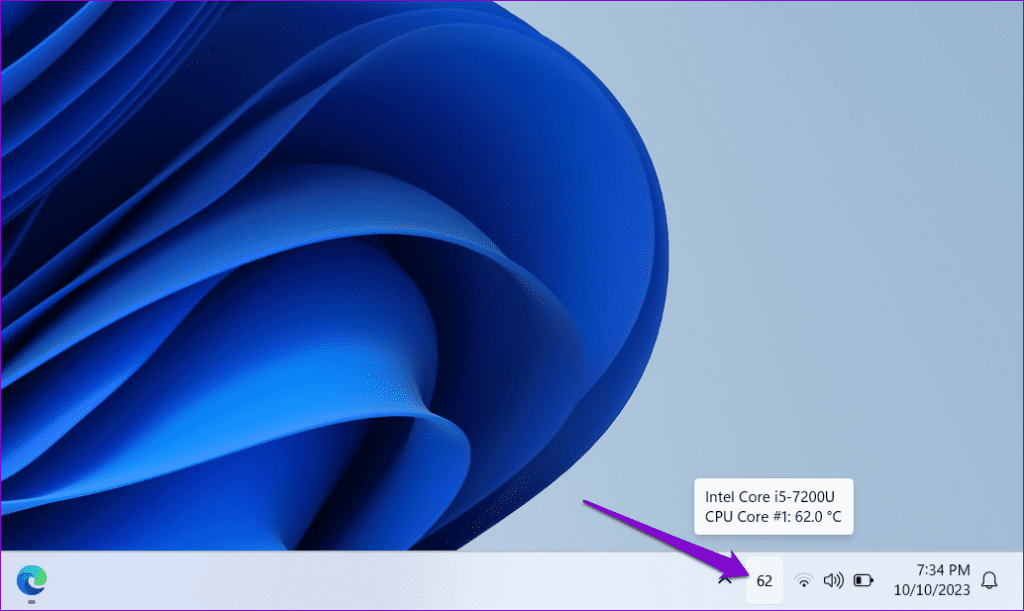
And that’s it. You should now see the temperature of the CPU on the Windows taskbar.
Check CPU Temperature Without a Third-Party App
Prefer not to rely on a third-party tool to check the CPU temperature? No worries; you can also check your CPU temperature without these tools. However, it requires you to enter your PC’s BIOS/UEFI menu, which is not as quick as the methods mentioned above.
To check the CPU temperature on Windows in the BIOS/UEFI menu, use these steps:
Step 1: Press the Windows + S keyboard shortcut to open the search menu. Type recovery options in the box and press Enter.

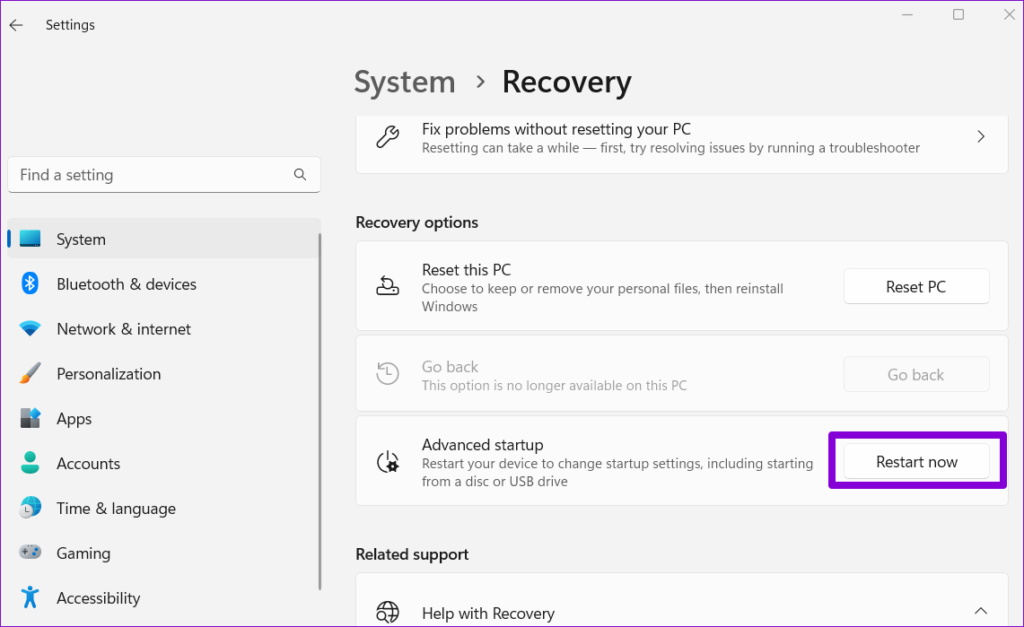
Step 2: Click the Restart now button next to Advanced startup.
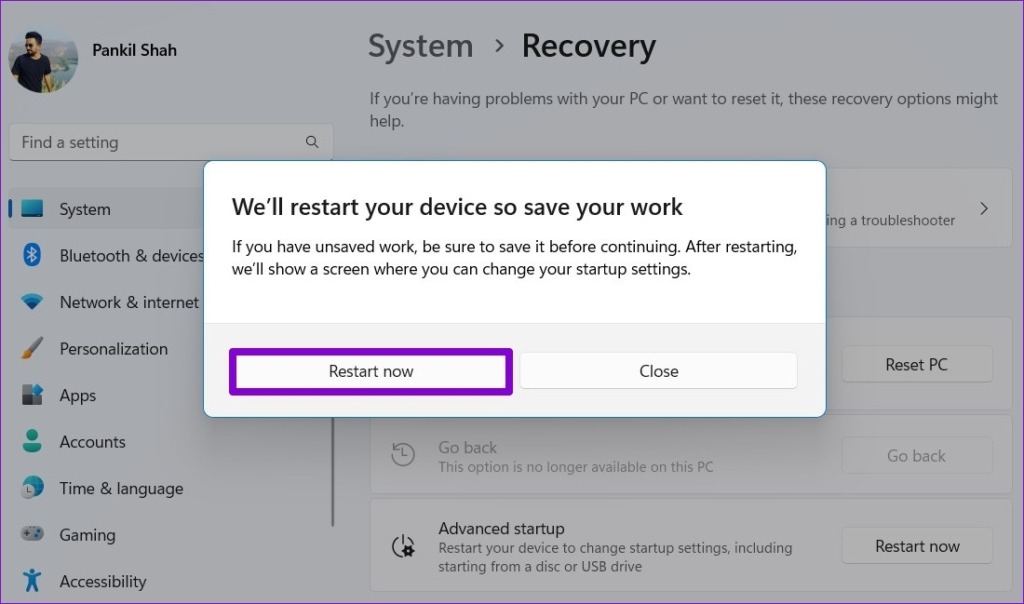
Step 3: Click the Restart now button.
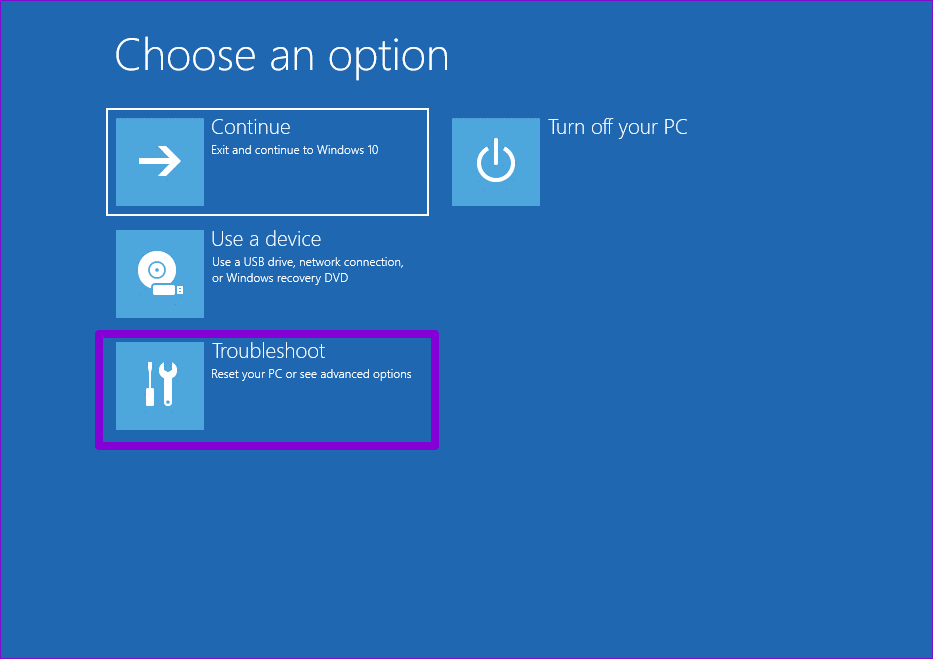
Step 4: Wait for your PC to reboot, and a blue screen should appear. Select the Troubleshoot option to continue.
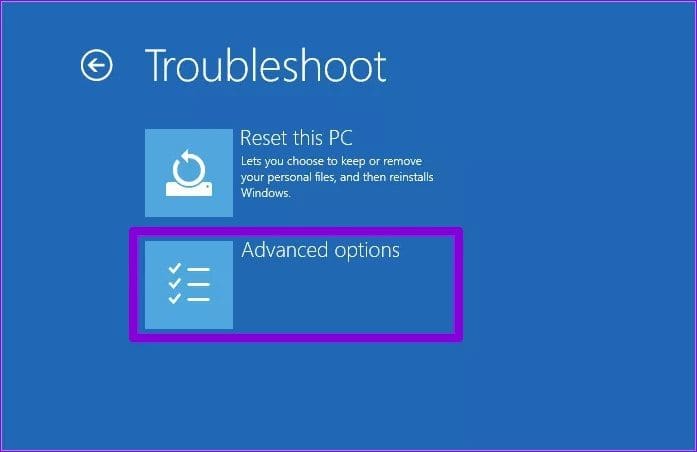
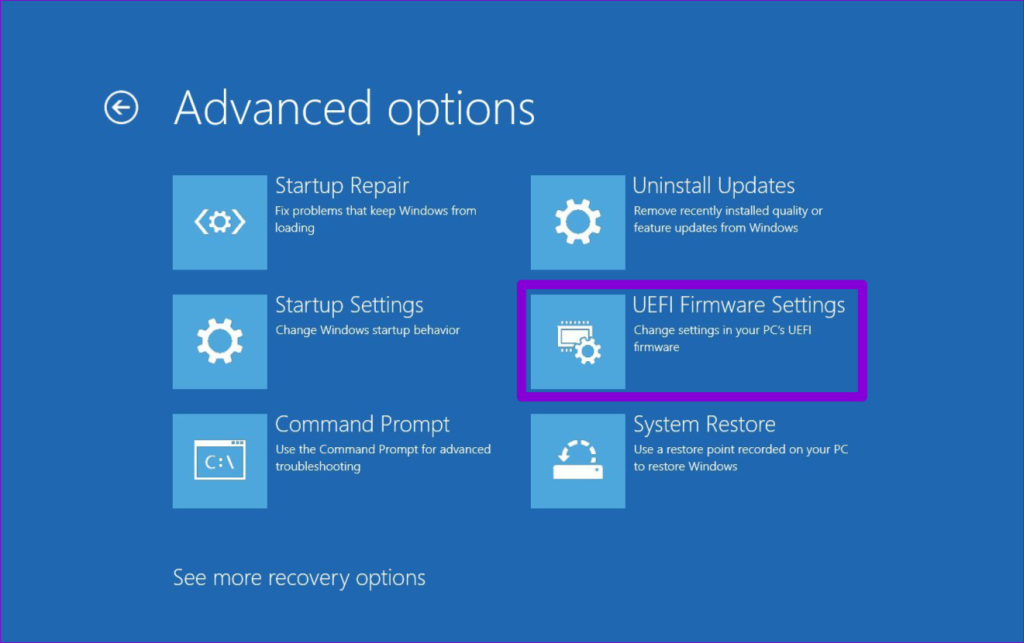
Step 5: Go to Advanced options.
Step 6: Select the UEFI Firmware Settings option.
Step 7: Once you’re in BIOS, head to the Hardware Monitor section and look for the CPU Temperature entry.
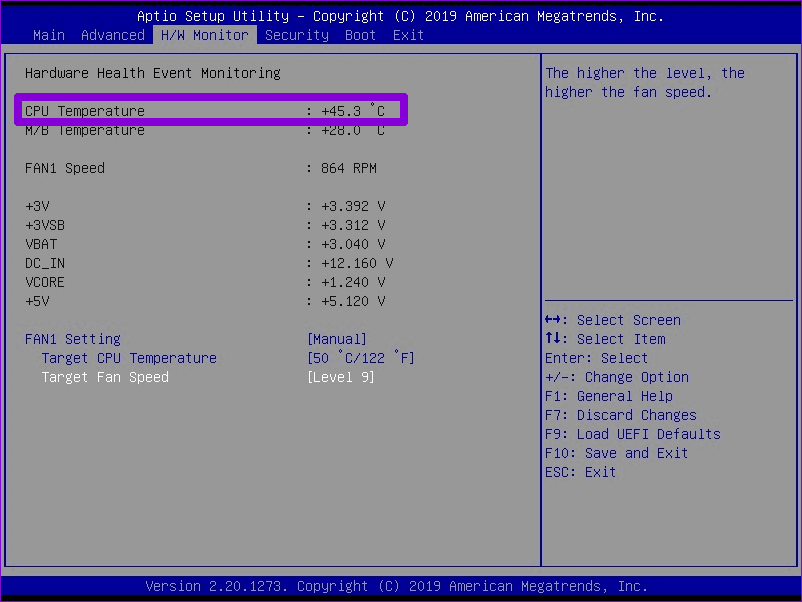
It is important to note that checking the CPU temperature in the BIOS or UEFI menu only shows the temperature when your computer is idle. The actual temperature when you boot up your PC and run applications will be much higher.
FAQs on CPU Temperature on Windows
While a good CPU temperature varies depending on your CPU’s specifications and current load, anything between 35-65°C (or 95-149°F) is acceptable when your PC is idle or under normal load. That said, temperatures around 70-85°C (158-185°F) are safe if you are gaming or performing other demanding tasks.
Cleaning the dust inside your CPU, using a cooling pad, updating drivers, and disabling unnecessary startup programs can help reduce the CPU temperature significantly on Windows.
Monitoring CPU Temp Made Simple
High temperatures can hamper your CPU’s performance and health. Displaying the CPU temperature on your Windows PC’s desktop or taskbar can help you monitor it and take steps to cool it down if necessary, so you can enjoy smooth performance while gaming or working.
Was this helpful?
Last updated on 04 November, 2023
Read Next
 Top 8 Windows Temperature Monitor and Control Software
Overheating is a common cause of crashes on Windows computers.
Top 8 Windows Temperature Monitor and Control Software
Overheating is a common cause of crashes on Windows computers.
 Top 8 Ways to Fix Windows Explorer High CPU Usage on Windows 11
Windows Explorer is the file manager application on Windows to view the data and also access the Control Panel options.
Top 8 Ways to Fix Windows Explorer High CPU Usage on Windows 11
Windows Explorer is the file manager application on Windows to view the data and also access the Control Panel options.
 6 Best Ways to Fix iPhone Weather Showing Wrong Temperature
With the iOS 15 update, Apple is slowly pushing the Dark Sky integration in the iOS weather app.
6 Best Ways to Fix iPhone Weather Showing Wrong Temperature
With the iOS 15 update, Apple is slowly pushing the Dark Sky integration in the iOS weather app.
 How to Check the Temperature of Your iPhone
Heat is the arch nemesis of any electronic device - and your iPhone has several hardware systems and software algorithms to keep the temperature at bay.
How to Check the Temperature of Your iPhone
Heat is the arch nemesis of any electronic device - and your iPhone has several hardware systems and software algorithms to keep the temperature at bay.
 How to Reduce Zoom CPU Usage in Windows 11
Zoom is the go-to application for attending online classes or meetings.
How to Reduce Zoom CPU Usage in Windows 11
Zoom is the go-to application for attending online classes or meetings.
 Windows Audio Device Graph Isolation: Fix High CPU Usage
The productivity of your work can be easily influenced by how your Windows PC performs.
Windows Audio Device Graph Isolation: Fix High CPU Usage
The productivity of your work can be easily influenced by how your Windows PC performs.
 Top 7 Fixes for Discord’s High CPU Usage on Windows
Is Discord using too much CPU on your Windows 10 or 11 computer?
Top 7 Fixes for Discord’s High CPU Usage on Windows
Is Discord using too much CPU on your Windows 10 or 11 computer?
 6 Ways to Fix Windows Modules Installer Worker High CPU Usage
If you've ever found your computer's fan working overtime and the CPU usage going sky-high, you're not alone.
6 Ways to Fix Windows Modules Installer Worker High CPU Usage
If you've ever found your computer's fan working overtime and the CPU usage going sky-high, you're not alone.
The article above may contain affiliate links which help support Guiding Tech. The content remains unbiased and authentic and will never affect our editorial integrity.